In the September '99 issue of RCSD, Lee Murray continued a series of articles with part-4 entitled Examples of good and weak soaring conditions. He discussed the fact that air temperature generally decreases with altitude, that over night cooling creates an inversion layer where morning ground temperatures are cooler than the air just a few hundred feet above, and lapse-rate, where an expanding air mass cools by a predicatable amount as it rises. He also referenced several web pages that provided up-to-date weather data. This peaked my curiousity.
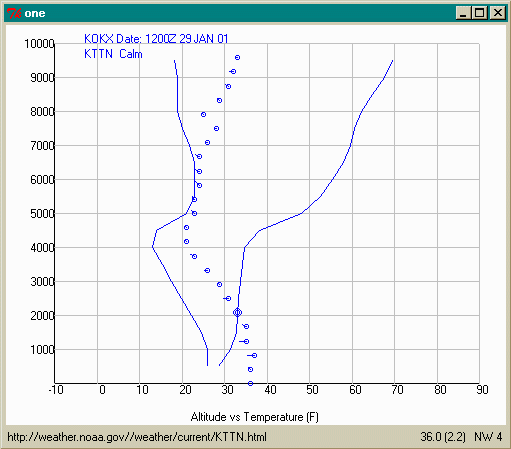
I was just learning to fly, and wanted to know if it was me, or really not that good a day. I thought it would be useful to study weather data in order to be able to identify good soaring conditions. Since I was willing to take afternoons off from work to go flying, I wanted a good way of predicting better than average soaring days. This ultimately lead to a simple computer program that fetches weather data off the web, reformats it, and plots it in a more useful form. The figure is an example of the output.
It shows upper-air (radiosonde) data for station KOKX, Brookhaven, Long Island, and the 24-hour ground temperature summary for Trenton, NJ (KTTN). The script was run around 5:30 PM on Jan 29, 2001. The two solid lines represent upper-air data, and the small circles represent 24-hour ground data. The latest ground reading (5PM) is at the bottom. Small straight lines from the small circles represent wind speed and direction (pretty calm). The ground reading with concentric circles representing noon, indicates variable winds (more on this later).
The solid line on the left represents actual upper-air data. The solid line on the right represents ground adjusted data. Since rising masses of air decrease in temperature by approximately 5oF/1000-ft, the curve on the right represents the ground temperature that must be exceeded for rising air to reach that altitude. For this data, an air mass at a ground temperature of less than 33o would not rise above roughly 1500 ft. But once ground temperatures exceed 33o, the air mass could rise to 4000 ft. This is the case at noon, which reached 33o, and where variable winds were recorded. I would suggest that this is a good example of the noon balloon.
The program is written in TCL (tickle), one of several scripting languages popular today. It is well suited for reading web pages using sockets, string processing, and graphics, but weak at arithmetic processing. The TCL interpreter can be downloaded from http://dev.scriptics.com/software/tcltk/downloadnow82.html. The TCL download package contains libraries and examples, besides the interpreter and .dll files needed. These are useful if you want to learn more about TCL, and use it in more sophisticated applications.
The weather program files can be downloaded from https://ciurpita.tripod.com/weather/weather_4.zip. The zip file contains five .tcl script files, a readme file, a desktop shortcut, and examples of the two types of web-pages downloaded in a tmp directory. The tmp directory is needed in the working directory for the scripts to work properly.
    #!wish82 -f

    source readurl.tcl
    source plot.tcl

    set colorList {red brown blue black}
    set altMax    10000.
    set WIDTH     400
    set HEIGHT    400

    set stations { KIAD KALB KOKX }
    source upperAir.tcl

    set stations {KBLM KLNS KTTN }
    source 24HourTemp.tcl
The main script allows some variables to be set, and then calls other scripts. The first line runs the TCL window interpreter. The next two lines load sub-function files. The next four line set TCL variables to customize the display. ColorList identifies the sequence of colors to be used in displaying more than one stations data. AltMax sets the maximum altitude to display. WIDTH and HEIGHT set the display window size. The next two lines select the upper-air stations to collect data from and then process it (i.e. upperAir.tcl). And the last two lines select the local stations to collect 24-hour weather summary data from and then process it (i.e. 24HourTemp.tcl).
This is a simple, non-user-friendly program. To select different stations, you need to modify (or copy and modify) the main script, using any text editor, such as notepad or wordpad. I typically collect upper-air data from two additional major weather stations at Washington, DC (KIAD) and Albany, NY (KALB). I also collect 24-hour data from a station nearer the ocean at Belmar, NJ (KBLM). So my script has the lines:
	set stations {KOKX KIAD KALB}
	source upperAir.tcl

	set stations {KTTN KBLM}
	source 24HourTemp.tcl
You can change the color sequence to your liking. The same sequence is used for both upper-air and 24-hour summary data. You may need to add more colors if you display more than four stations.
Every day, radiosonde balloons are released at major weather stations all over the world to measure air temperatures, dew-point, wind speed and direction. Measurements are made twice a day at 0 and 1200 hours (GMT). Greenwich Mean Time is equivalent to Zulu time and Coordinated Universal Time (UTC), and is the time as reckoned from the meridian at Greenwich, England (Webster's). Data for the U.S. is usually available within the hour from the web at http://weather.unisys.com/upper_air/skew/index.html. The Unisys web page provides a U.S. map that graphically identifies the weather stations with this information, and which can be easily selected to display the data in a variety of forms.
Local ground weather conditions are also monitored by many more weather stations and local airports. They normally collect ground temperatures, dew-point, wind speed and direction. Local weather summaries for the past 24 hours are also available over the web from NOAA, for example at: http://weather.noaa.gov/weather/current/KTTN.html. Local weather stations can be located from web-pages for each state, for example at http://iwin.nws.noaa.gov/iwin/nj/nj.html.
I look forward to your comments and suggestions for improvements.
I can be contacted at  .
I would like to see some graphical sailplane analysis programs
developed as TCL-scripts that can easily be distributed.
.
I would like to see some graphical sailplane analysis programs
developed as TCL-scripts that can easily be distributed.