The November 2003 RCSD titled Numerical Understanding of Planforms showed how the Vortex Lattice Method and the UIUC Airfoils database were used to calculate the lift and drag at each point on the wingspan. It showed how the calculated values of lift and Cl, can be related to measured values of Cd from the UIUC database, then used to calculate drag, at each point across the span, and finally the total profile drag. It does not discuss induced drag which is proportional to lift. This article will complete the discussion by considering circling flight.
| ||||||||||||||||||||||||||||||||||||
The previous article focused on the steps involved in the analysis, not a valid comparison of planforms. It very crudely compared a tapered and non-tapered planforms, showing little (<2%) difference in total drag between the two. However, this comparison may be misleading since it was only at one airspeed.
Table-1 shows values for each planform at several other airspeeds. These additional airspeeds do not produce lift equal to the weight of the aircraft. It shows that at two airspeeds, the non-tapered planform actually has less drag than the tapered planform, and one was used in the comparison in the previous article.
|
|
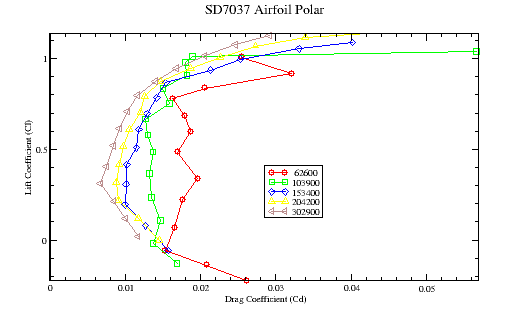
The reason for the varying results in the table is the non-linear behavior of drag, especially at lower Reynolds Numbers. (See Figure-1 for the Airfoil Polar of the SD7037 airfoil used in the comparision.) In other words, a slight change a airspeed may lead to significant changes in drag that are not proportional to the change in airspeed.
This same behavior applies to a tapered planform where even though the airspeed is constant across the span, the Reynolds Number varies because of the varying chord length.
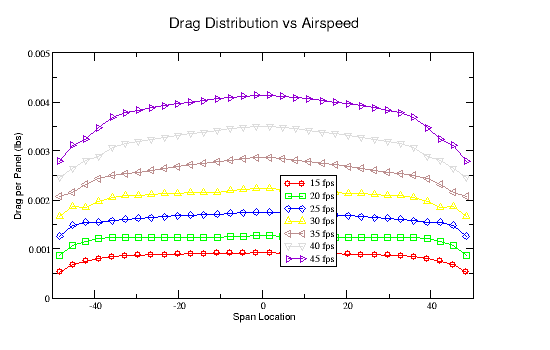
Figure-2 illustrates the drag distribution for various airspeeds for the tapered wing planform. Notice how the drag decreases near the wing tips as chord length and Reynolds Number decrease. For non-circling flight, the airspeed is constant across the wingspan and the curves are symetrical.
|
For the results shown in Figure-2, the wing is divided into 32 panels, each panel representing a section of the wing from leading to trailing edge. The indicated drag is the total drag corresponding to a panel. The total drag produced by the wing is the sum for all panels. (roughly 32 times the average value of a particular curve). Even though the drag coefficient generally improves (decreases) as airspeed and Reynolds Number increase, the total drag will increase since it is proportional to the square of airspeed.
The above digression in drag variation with airspeed leads naturally into circling flight where the airspeed across the planform is not constant. This article considers a wing at five bank angles: 0, 15, 30, 45, and 60 degrees. In this analysis, the comparison between the different bank angles keeps the average airspeed constant. If the airspeed for the aircraft with zero bank angle generates sufficient lift to support the weight of the aircraft, then at any bank angle greater than zero, there will be insufficient lift to support that weight. This, therefore, compares non-realistic flight conditions, and is only useful in this comparison of drag.
In this analysis, the aircraft is banked to the left, the left (inner) wing tip is lower than the right, and the aircraft is circling counter-clockwise. The airspeed of the inner wing-tip is therefore slower and the outer wing tip is faster than the average airspeed.
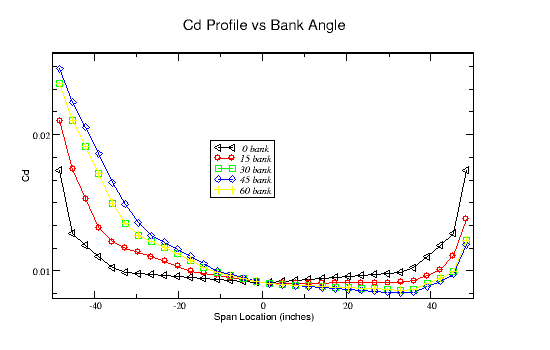
Figure-3 illustrates the drag coefficient (Cd) across the span for the tapered planform at each bank angle. The zero bank angle is symetrical and serves as a reference. The drag coefficient increases near the wing tips as the chord length and Reynolds Number decrease.
As the wing is banked to the left, the left wing tip travels more slowly and its Reynolds number decreases. Its drag coefficient therefore increases. The drag coefficient improves on the right wing tip as its airspeed and Reynolds Number increase.
|
While five bank angles are considered, only four appear in the plot because the data is the same for bank angles of 30 and 60. The airspeed difference at the wing tips is a maximum at 45o, and reverses once the bank angle is increased past 45 until it is again constant across the span at 90o.
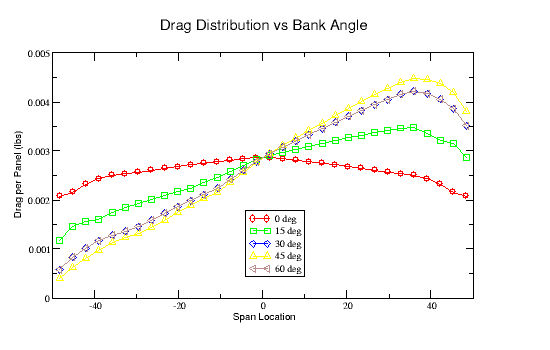
Figure-4 shows the total drag per panel, which is proportional to drag coefficient, airspeed and panel area. It shows that even though the drag coefficient increases at the left wing tip as the bank angle increases and its airspeed slows, the actual drag decreases because it is related to the square of the airspeed and panel area, both of which are decreasing.
|
The total drag on the outer wing is generally increasing. But at least for this planform, it appears that the combination of improved (decreasing) drag coefficient and decreasing wing area near the wing tip results in less total drag near the tip than more inboard. So while the aircraft is circling counter-clockwise there is more drag on the outer wing, even though it may be more efficient in terms of Cd.
Table-2 compares the total drag at various bank angles, and between the tapered and non-tapered planforms. The tapered planform has less drag than the non-tapered planform for all bank angles greater than zero that are shown. It also shows the symmetry around the 45 o bank angle, where the total drag is the same for bank angles of 30 and 60. And it also shows that the drag increases with bank angle, increasing by roughly 5.5% at 60o.
| |||||||||||||||||||||
However, while the above table serves as a reference of how drag is affected when the plan is circling, it does not model realistic flight conditions While maintaining a constant airspeed maintains the total lift, this lift is no longer vertical as the bank angle increases. Greater lift is required as the bank angle is increased to support the weight of the aircraft, and most likely will result in even greater drag.
Further, more realistic comparisons are complicated by the number of possible mechanisms that can be used to establish stable circling flight. These include changes in airspeed, angle-of-attack and trailing-edge deflection (flap and/or aileron). And even though the airspeed is different on each wing, both wings must produce equal lift to prevent rolling. Aileron, dihedral and aircraft yaw asymetrically affecting the angle-of-attack on each wing, can all be used to balance the lift on each wing.
This and the November article present some aerodynamic concepts in ways that at least I have not seen before. This may help some people better understand these concepts. For the examples used, it showed which concepts had the greater affect (drag coefficient vs. total drag), but also, in many cases, how little the difference may be. I'd like to thank Dave Register and Lee Murray for their encouragement and help in this and previous articles.