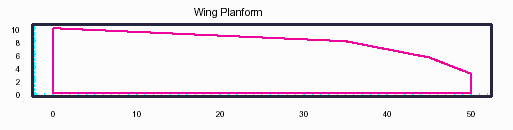
Figure 1 - Planform
Many model RC articles and books qualitatively discuss various aerodynamic concepts. These articles explain fundamental concepts without going into too much detail. But I find it difficult to fully understand some concepts without seeing real numbers. While one design aspect may be relevant, another may be more important. For example, we know that
An important question is how much worse is the drag because of the smaller wing tip chords?
Figure-1 illustrates a three section planform that attempts to have the uniform lift coefficient of an elliptic planform. This tapered planform has an area of 807.5 sq.in. The tapered planform will be compared to a a non-tapered planform with a constant chord of 8.1" chord and a comparable wing area of 810 sq.in.
| Span Position (in.) | 0 | 35 | 45 | 50 |
|---|---|---|---|---|
| Chord Length (in.) | 10 | 8 | 5.5 | 3 |
Figure-2 illustrates the lift distribution for the tapered and non-tapered planforms described above, for an airspeed of 35 ft/sec, and and angle-of-attack, 4o. The lift distribution is calculated using the Vortex Lattice Method. described by Mason, Applied Computational Aerodynamics, and also implemented in John Hazel's LiftRoll Spreadsheet. The lift distribution represents the lift generated per unit (ft) of span. For example, consider the tapered distribution. It's average value is roughly 0.36 lb/ft. and results in 3 lb of lift for a 100 in, 8.3 ft span.
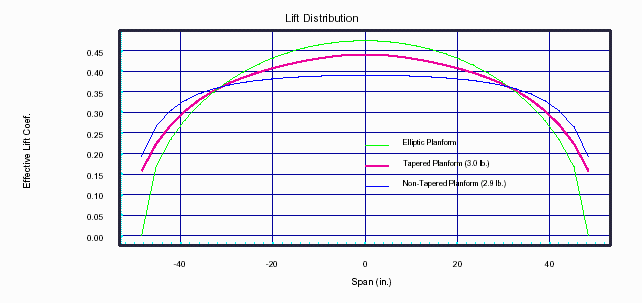
Figure-3 illustrates the effective lift coefficient for the two planforms. The effective lift coefficient is calculated by dividing the lift from Figure-2 at any spanwise panel on the wing by 0.5 r V2 Ss, where Ss is the area of the wing at that point on the span (panel width · average panel chord).
While the tapered planform is not the most optimal, it results in a more uniform lift coefficient across the entire span. The effective lift coefficient of the non-tapered planform decreases rapidly near the tips. The lift coefficient decreases because the lift decreases while the wing area (i.e. chord) remains constant. The lift also decreases near the tip of a tapered planform, but the wing area is also decreasing, maintaining a more constant lift coefficient.
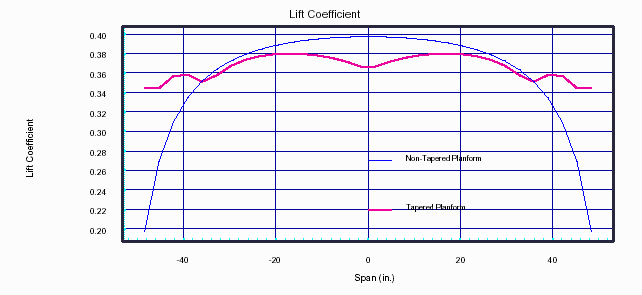
The lift at any point on the wing is affected by adjacent sections of the wing. The lift at an interior section of the wing is stronger because of the lift generated on either side of that section. The lift at the wing tip is only strengthened from one side, and crossflow around the tip weakens it further. This is what the Vortex Lattice Method captures. This same affect occurs on the tapered planform near each panel break.
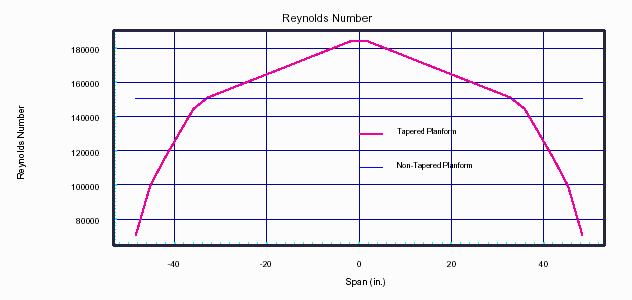
Figure-4 illustrates the Reynolds Numbers across the span for both planforms. It depends on airspeed, which is constant in this case, and chord. As you would expect, the Reynolds Number is constant for the non-tapered planform, and decreases as the tips narrow on the tapered planform.
Given the effective lift coefficient and Reynolds Numbers, airfoil data, from the UIUC Airfoil Data Site, can be used to determine the corresponding drag coefficient. The SD7037 airfoil was used in this example, and is shown in Figure-5. It is important to recognize that since the Reynolds Number may vary across the span, different airfoil polars apply to different sections of the wing. (See "Understanding Airfoil Polars Without Math" by Kuhlman, ...).

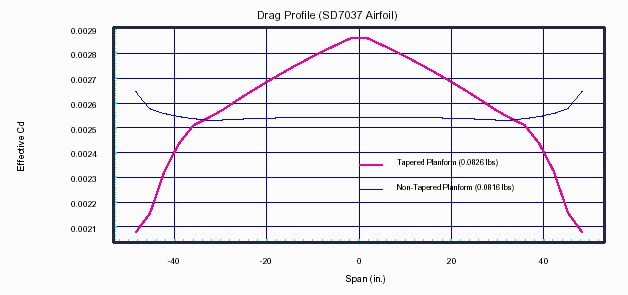
Figure-6 shows the corresponding drag coefficient across the span for both planforms. The drag coefficient increases significantly near the tips of the tapered planform as the Reynolds Number decreases. But the Reynolds Number is constant (90000) for the non-tapered planform, and the drag coefficient increases only slightly as the lift coefficient decreases from 0.4 to 0.2 (see Figure-3 and 5) at a Reynolds Number of 98700.

Figure-7 shows the actual spanwise drag. This is calculated from the spanwise drag-coefficient in Figure-6, wing sub-section areas, and airspeed (0.5 r V2 S Cd). Despite the higher drag coefficient near the tips, the smaller wing tip areas of the tapered planform result is less wing tip drag than the non-tapered planform. The total drag for the tapered planform of 0.0826 lbs (1.3 oz) is only 1.2% greater than the 0.0816 lbs of drag for the non-tapered planform. And this ratio will vary with flight parameters and may result in less drag for a tapered than non-tapered planform.
It is interesting to see that the final results, for the given flight conditions, show little difference in total drag between the tapered and non-tapered planforms. (However, there may be other reasons to be concerned with lower wing tip Reynolds Numbers).
This note has provided a quantitative comparison of two simple wing planforms. I hope that real numbers make clear what lengthy discussions do not. With the the power of PCs, algorithms like the Vortex Lattice Method, and the UIUC Airfoils Database, there is less reason to guess. I hope these plots tie together and provide more concrete descriptions of several aerodynamic concepts. A possible future article will consider circling flight where the airspeed is not constant across the span, with corresponding affect on Reynolds Numbers and drag.